MultiWalk: Taking a detailed look into the walkforward analysis process
Periodically I will have some users ask to see the step-by-step process of MultiWalk’s walkforward analysis. I have several options on my “Developer’s” screen that I have used to verify and debug MultiWalk’s walkforward analysis. You can use these to do your own verification and comparitive analysis, especially if you have done a manual walkforward and want to see how your results compare to MultiWalk’s.
In short, remember that the walkforward process is actually a structured modeling and simulation training technique. It is used as a building block in many machine learning and artificial intelligence applications.
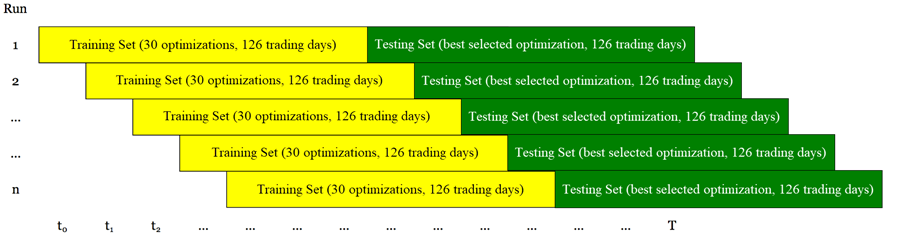
In my example below, I’ll be using an unanchored “rolling” walkforward based on 126 in-period trading days and 126 out-period trading days and 30 optimized iterations for each walkforward. You can use MultiWalk’s calendar day period type, also, to run these same tests, but I chose to use trading days for this example since it has been widely used in Kevin’s strategy factory process.
You can apply the same steps below to any strategy. But it would be best to use a small project for this since many large data files will be created for each optimization and walkforward. In my example, I used just one symbol and bar interval, 30 optimized iterations and just one 126/126 in/out period with the Net Profit fitness function as the optimized iteration selection method.
Setup
To view this process in detail, use the following steps:
First, enable the Developer screen if you have not already done so.
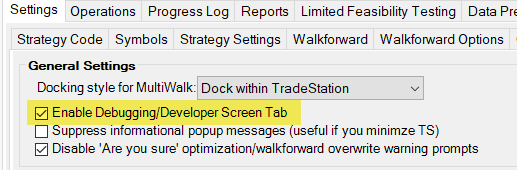
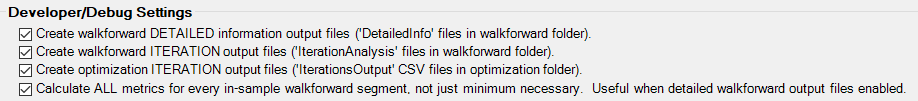
Then, enable all these options on the Developer screen tab:
Output Files
When you run the MultiWalk project, you will have additional files in both the Optimization Files and Walkforward Files folders:
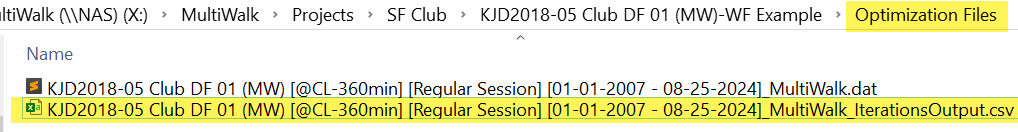
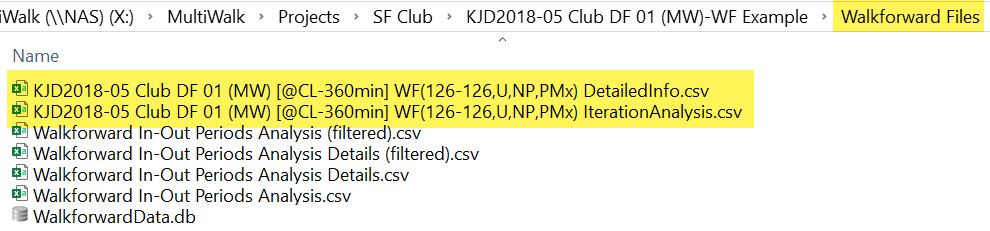
This file IterationsOutput.csv contains all the detailed data from the optimization that was performed using TradeStation’s Optimization API. This data is used by MultiWalk when “slicing” the data into the walkforward in/out windows.
The file DetailedInfo.csv contains a high level snapshot of each walkforward segment, as described in the training set/testing set graphic above.
The file IterationAnalysis.csv is a composite view of both the “IterationsOutput.csv” and “DetailedInfo.csv” output. It is the most detailed view of the walkforward process. This file tends to be quite large, which is why I used a small project for this example.
Using the output from the following three files, you can easily reconstruct the entire walkforward process in detail:
Since this example is using 126/126 trading days and net profit for the fitness function, you would need to include 126 trading days (data points) in each walkforward window and tally up the total mark-to-market net profit for each 126 trading day window.
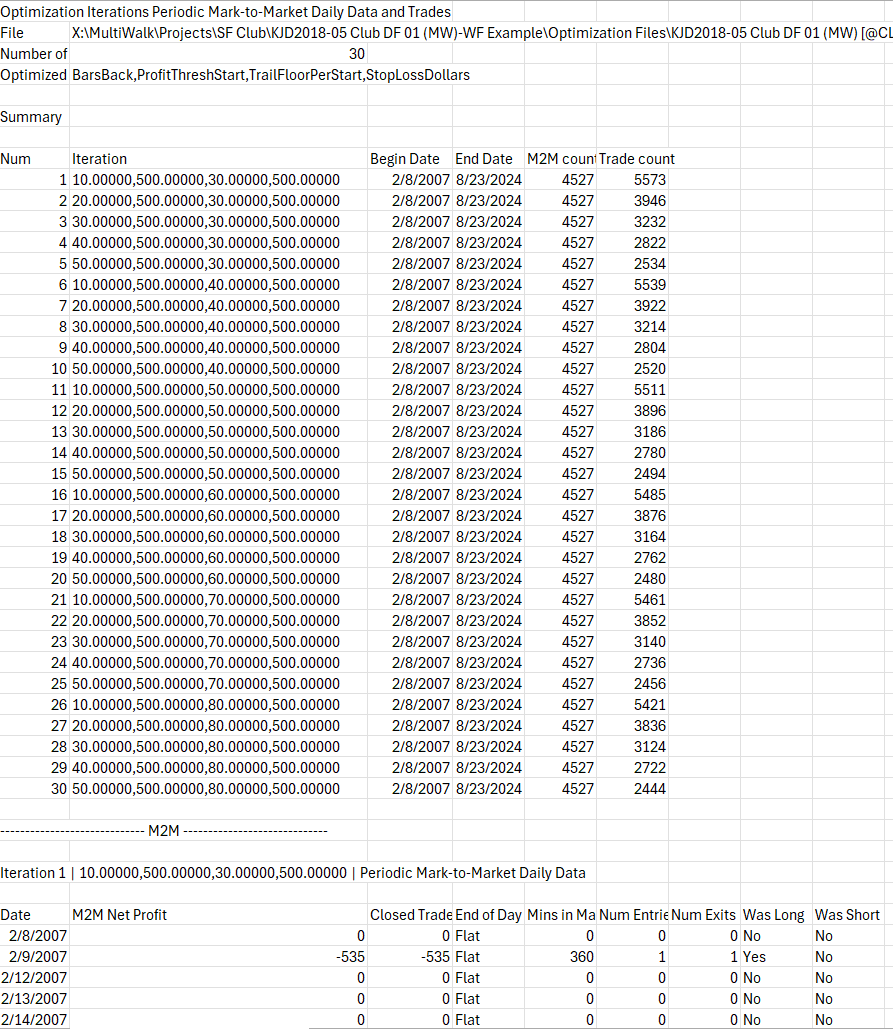
IterationsOutput.csv
Example of IterationsOutput.csv file:
While you do not specifically need this file to examine MultiWalk’s walkforward process since the same data is contained in the IterationAnalysis.csv file, this file does give a clear view of only the optimized iteration data itself.
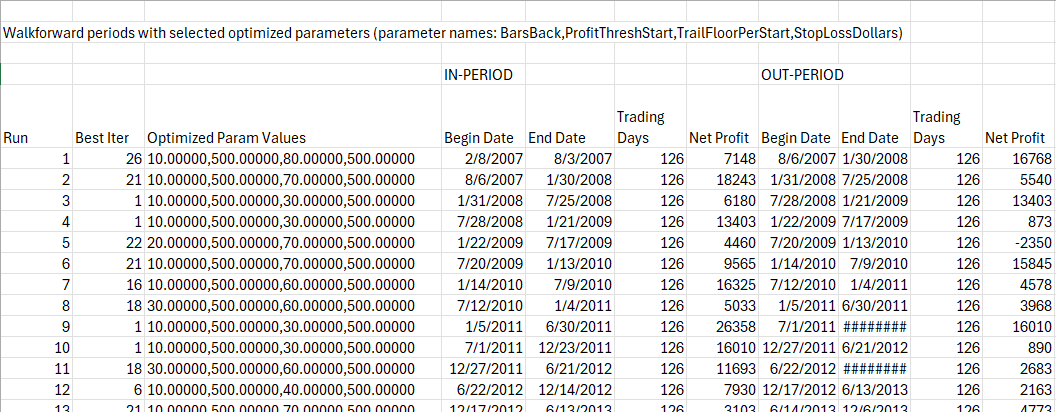
DetailedInfo.csv
Example of DetailedInfo.csv:
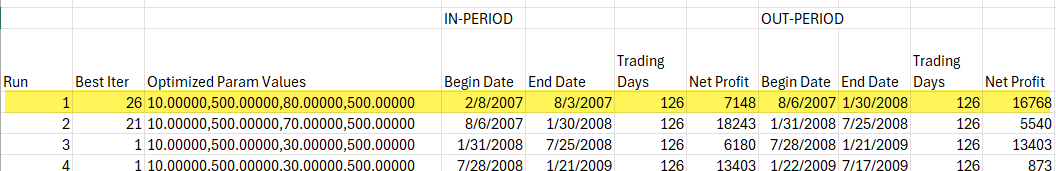
I have hidden irrelevant columns in Excel for this example. This table shows what iteration was chosen for each in/out period, number of trading days in each and the begin/end dates that comprise those 126 trading days.
IterationAnalysis.csv
There are two sections to this file. This file gives the most detailed insight into MultiWalk’s walkforward implementation.
Section 1
The first section repeats the data found in the IterationsOutput.csv file, but presents it in a horizontal rather than tabular view.
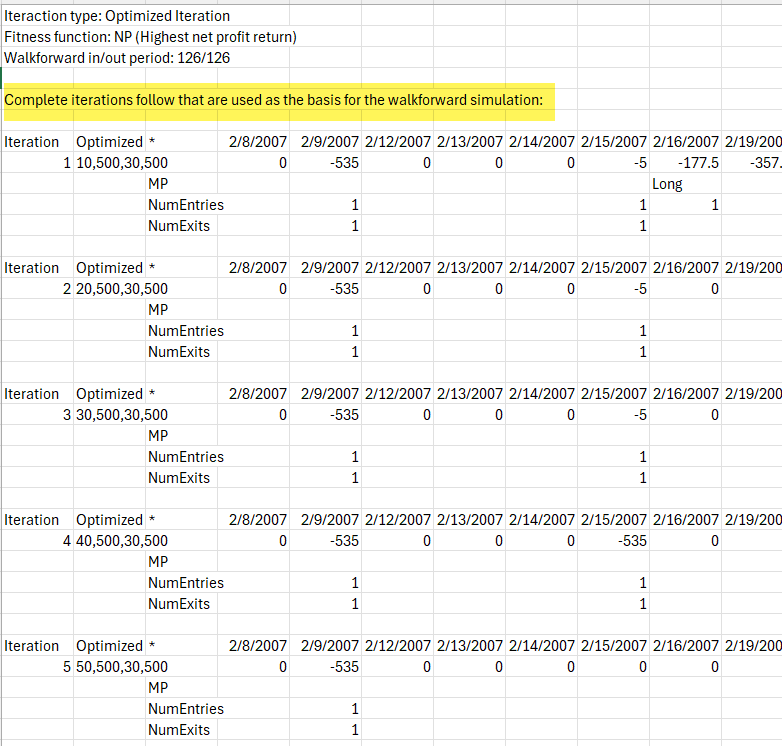
Section 2
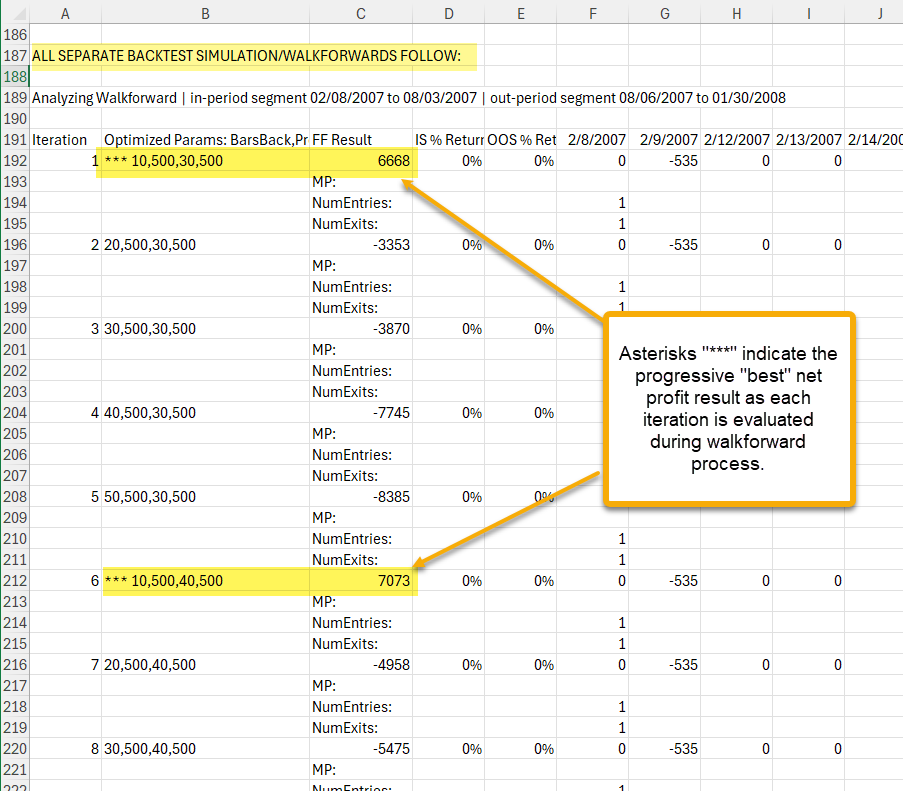
This second section is, by far, the most useful detailed description of the walkforward process for any given walkforward. It shows the iterations that are being selected and their fitness function values for each walkforward segment.
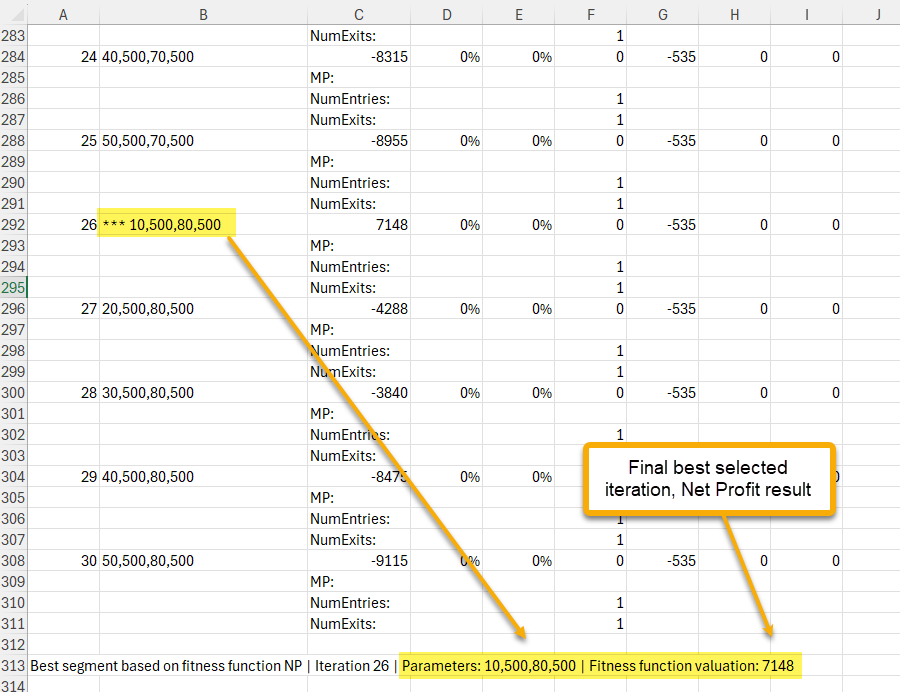
In our example, row 192 below indicates that the walkforward evaluated the first iteration as best with a Net Profit of $6668, then switched and chose iteration 5 (row 212) as best, until finally completing the analysis by finally choosing iteration 25 (row 292) $7148 as the best for this particular walkforward of 126 trading days. MultiWalk will then use iteration 25 as the testing out-period for the next 126 trading days.
Pulling it all together
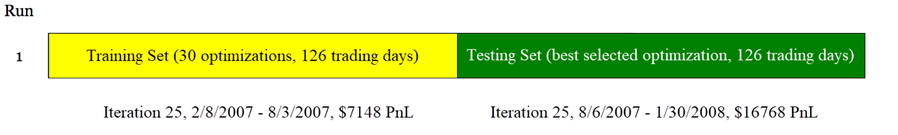
The final selection for the first walkforward run had a 126 trading day in-period net profit of $7148. MultiWalk then used the results from that iteration for the 126 trading day out-period, which resulted in a $16768 net profit. MultiWalk used the mark-to-market daily PnL of iteration 26 to construct the equity curve of that time period (8/6/2007 to 1/30/2008).
Applying this to the first run of our walkforward using the walkforward graphic at the beginning of this article, we get:
Using the results of the DetailedInfo.csv, we can see this clearly represented:
Hopefully this guide will give you enough information to understand MultiWalk’s walkforward analysis and how it is used to construct the final walkforward strategy results.