Optimization Only and Non-Optimized Utility Projects
It is possible to use MultiWalk to run a strategy across all symbols and time frames (bar intervals) and bypass the walkforward process. The strategy can be run once per symbol combination (as a non-optimized strategy) or run as a regular optimization (just as you would on a TradeStation chart). Optimization Only projects can use optimized or fixed input parameters. Non-walkforward/optimization only projects are run by selecting “Perform optimizations ONLY” on the MultiWalk Operations screen:

They will be displayed as “OptOnlyMetricsCalc” in the progress log.
Optimized Only and Non-Optimized (Utility) Strategy Projects
There are times when I want apply a strategy to all symbol combinations, but perform a regular optimization on the entire time period. The results can be calculated using all the fitness functions and metrics available to MultiWalk and can be written to the walkforward reports. The entire time period defined will be calculated. Incubation/out-of-sample period can also be defined.
There are also times that I want to apply a strategy to all symbol combinations, but just have that strategy run once (i.e., 1 iteration) that may or may not have optimized parameters. I call these “utility strategies” because they are not really a strategy in the sense that generates trades, but instead have some other purpose that has nothing to do with trading.
There are three options that control how performance results are (or are not) written to walkforward reports:
- No results. When creating a “utility strategy”, there would be no need to calculate or write performance results to the walkforward reports.
- Only include the BEST iteration as defined by the fitness function
- Include ALL iterations
Running Non-Optimzied Utility Strategy Projects
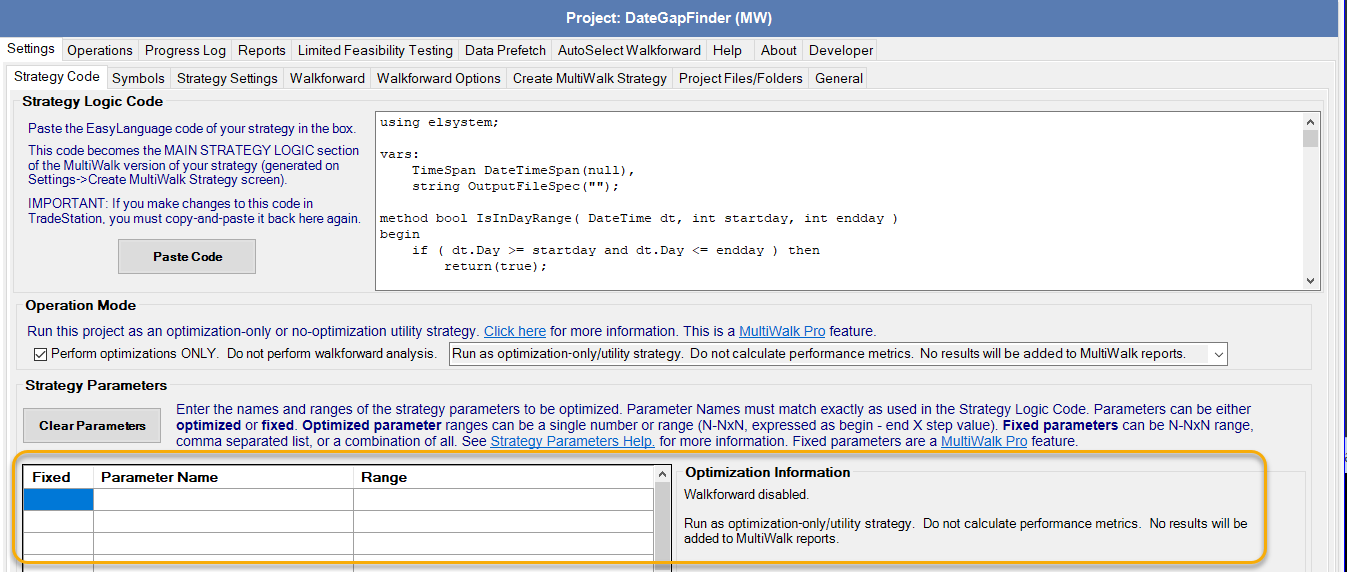
So why would you want to run a strategy that is not a walkforward or an optimization? There are many times that I want to apply what I call “utility strategies” to all symbols, but only want to run it once (i.e., 1 iteration) in order to perform a specific task. For example, I created a strategy that would look for missing gaps of dates and, on the last bar of the strategy, log these results to a file. Click here to get the actual project.
Notice that, for this strategy, there were no parameters at all.

I just wanted to run the strategy for this completely non-optimized purpose. Again, click here to get the actual project.
Running Optimization Only Projects
Create the project like you would for any walkforward project with the exception that the following options will NOT be used:

However, if you choose to actually include the optimization results in the walkforward reports, then I had to translate the walkforward settings into something meaningful, even though they are not used. Therefore, the walkforward settings will be fixed to the following for optimization-only projects:
- In/Out periods: set to “AD/AD” to mean “all data”
- Anchored/Unanchored: set to Anchored since analysis will always start on the first data point (trading day)
- Walkforward chart: “OptOnly” appended to the end of the walkforward chart name.
The final result will look something like this:

The only relevant part of the above name for the optimization is the fitness function that is used to identify the “best” optimization.
Once you have the setting defined for the optimization, run the project using the following “Perform optimizations ONLY” option. Choose if and and how you want to display performance results in the walkforward reports.

Optimization Only Reports
The results of optimization only projects are displayed like any walkforward entry, except that the results will identify the entry as an Optimization Only entry. The optimized parameters represented in the entry are display in the Optimized Input Parameter column.

If you also used Fixed Input Parameters, then both will be displayed for easy identification:

