Walkforward Reports And Filters
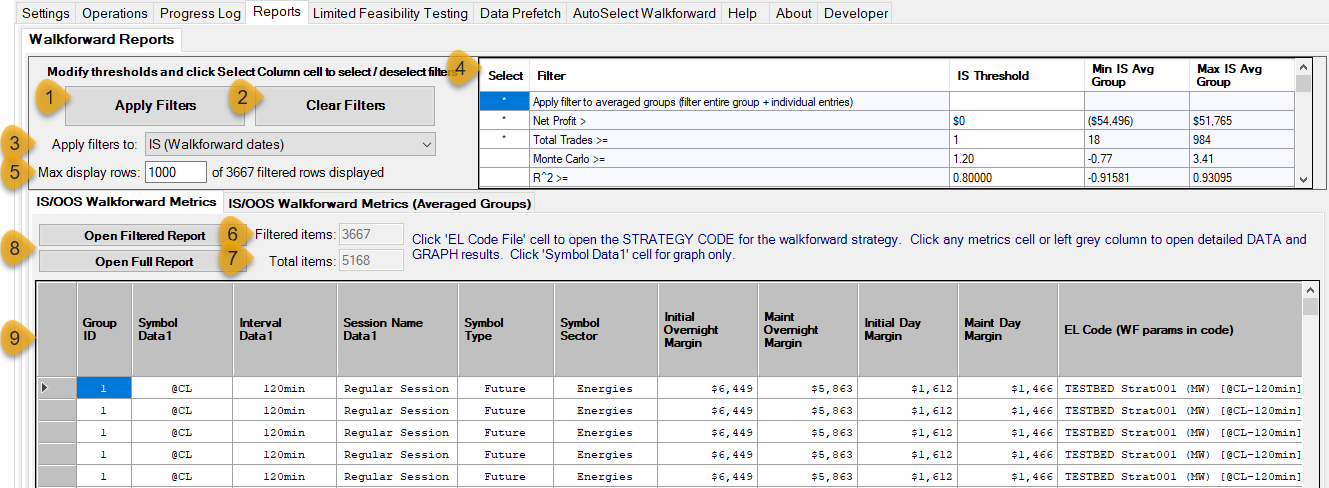
Anatomy of the filter screen
(1) Apply Filters
This button will apply the filters to the walkforwards in the project and display the performance results in the report table (9). It can also be used to refresh report table if necessary.
(2) Clear Filters
This button will clear all defined filters (4)
(3) Apply filters to

This option determines whether to apply the filters to IS only dates or IS+OOS dates (if incubation is defined). See IS and OOS Results below for more information.
(4) Filters
This is the filter definitions screen.
Performance Metrics
You can filter the walkforward displayed by setting minimum thresholds for many of the MultiWalk performance metrics:

Click on the Select column to select/de-select any filter. Enter the minimum threshold in the Threshold column. The Filter, Min Avg Group and Max Avg Group columns cannot be changed — they are display only columns for reference. The Min/Max columns indicate the smallest and largest metric of all walkforwards in the project. They give us the range of values possible for filtering.
Averaged Group Filter

If you select the above filter, then only walkforwards will be displayed that exceeded the minimum thresholds of selected metric filters that an entire averaged group passes, as well as the individual walkforward performances within that group.
For example, if you have selected the Apply filter to average groups filter and defined a minimum threshold of $100,000 for the net profit metric, then only averaged groups that exceeded $100,000 will be displayed. This is an extremely important nuance of the reports, because even if there were individual walkforwards within that averaged group that exceeded $100,000, they will not be displayed because the group average was below $100,000.
The below example has the walkforwards sorted on the IS Average Net Profit column in ascending order.

Each group represents 8 in/out walkforwards. However, only 1 entry is displayed for group 13 on the individual reports table:

Why? Because only 1 walkforward within the group of 8 passed the $100,000 minimum threshold. Notice that, for group 11, 4 out of the 8 in/out’s passed the minimum threshold.
OOS Averaged Group Filters
If you have an OOS/Incubation period defined, you can perform additional filters to identify those walkforwards that, on average, performed well as a group.
For example, if you want to display only those walkforwards where at least 50% of the in/out periods made money (i.e., net profit greater than zero) you would select this filter and set the IS Threshold to 50% :

(5) Max display rows
TradeStation is very slow when adding rows to a table and becomes increasingly slower as more rows are added. In order to manage this issue, this option will limit the number of walkforward rows displayed in the table.
IMPORTANT: you may have more filtered rows than are being displayed in the table as in the below example. This is extremely important since you may overlook some entries if Max display rows is less than the actual number of filtered walkforwards.
![]()
Note that there are 3667 possible rows to display, but only 1000 of them are being displayed because of Max display rows. Set Max display rows to 3667 or higher in this example to display ALL filtered rows.
(6) Filtered items
This value indicate the number of walkforwards after the filters have been applied.
(7) Total items
This value indicate the number of total walkforwards in the project.
(8) Open Filtered/Full Report
These buttons will open the report CSV files in your default spreadsheet application (such as Excel)
(9) Walkforwards
This is the table of filtered walkforwards. It is the display of walkforwards after the filters have been applied up to Max display rows. Be sure that Max display rows is set high enough to display all filtered walkforwards.
Walkforward Reports
Sorting Rows
You can click on any column header to sort the walkforward rows based on that column. Clicking the column repeatedly will toggle the sort between ascending and descending order.

IS and OOS Results
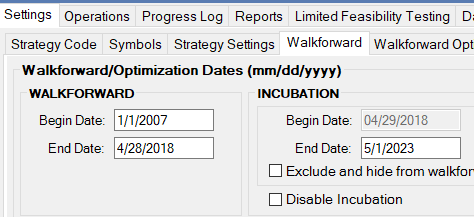
MultiWalk uses the traditional terms “IS” for in-sample data and “OOS” for reserved out-of-sample data. This does not to the IS and OOS periods of the walkforward itself. These refer to two date ranges defined for the entire project. In this context it refers to the dates that have been reserved for Kevin’s incubation period. Specifically, they refer to this screen:

If you have unchecked/cleared the “Disable Incubation” and “Exclude and hide” checkboxes, then OOS/Incubation results will be displayed in the walkforward reports. Otherwise only IS results will be displayed. If there is no OOS/Incubation period, then IS (“Walkforward” above) would be the entire date range of the project. The terms “Walkforward” date and “Incubation” date are used to remain consistent with Kevin’s terminology where possible.
Tabular Reports
There are two types of walkforward reports: IS/OOS Walkforward Metrics and IS/OOS Walkforward Metrics (Averaged Groups)
![]()
IS/OOS Walkforward Metrics report displays the individual walkforwards (after filters have been applied).
IS/OOS Walkforward Metrics (Averaged Groups) report displays the average performance of a group of walkforward in/out periods.
What Is A Walkforward Group?
A group is a collection of in/out periods as defined on this screen:

In this example, there are 8 periods defined. Each group on the IS/OOS Walkforward Metrics (Averaged Groups) table represents the average of all 8 walkforwards. Each group has an identifying number, displayed in the first column. This group number is also displayed on on the individual IS/OOS Walkforward Metrics table so that you can easily identify what walkforward belongs to what group.
Performance Data and Graphical Reports
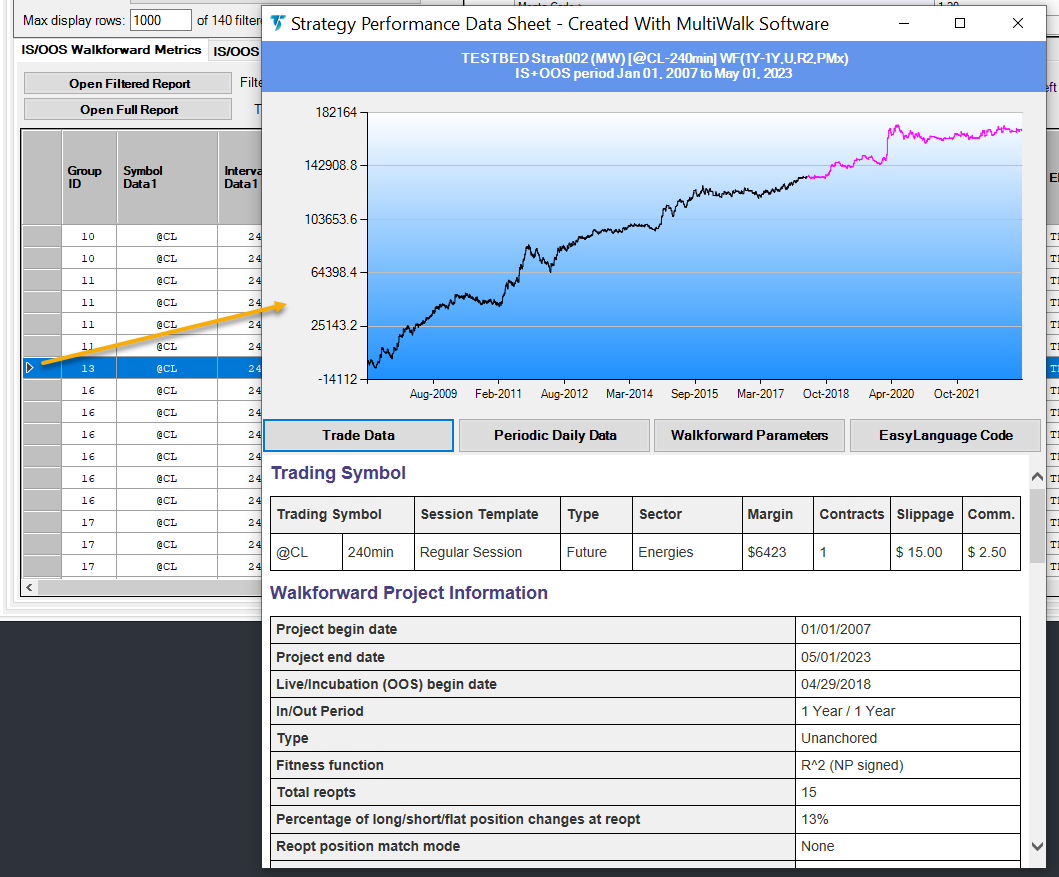
Clicking on the left-hand grey column will display the performance report for that walkforward entry. If you have an OOS/Incubation period defined, then both IS+OOS results will be displayed.

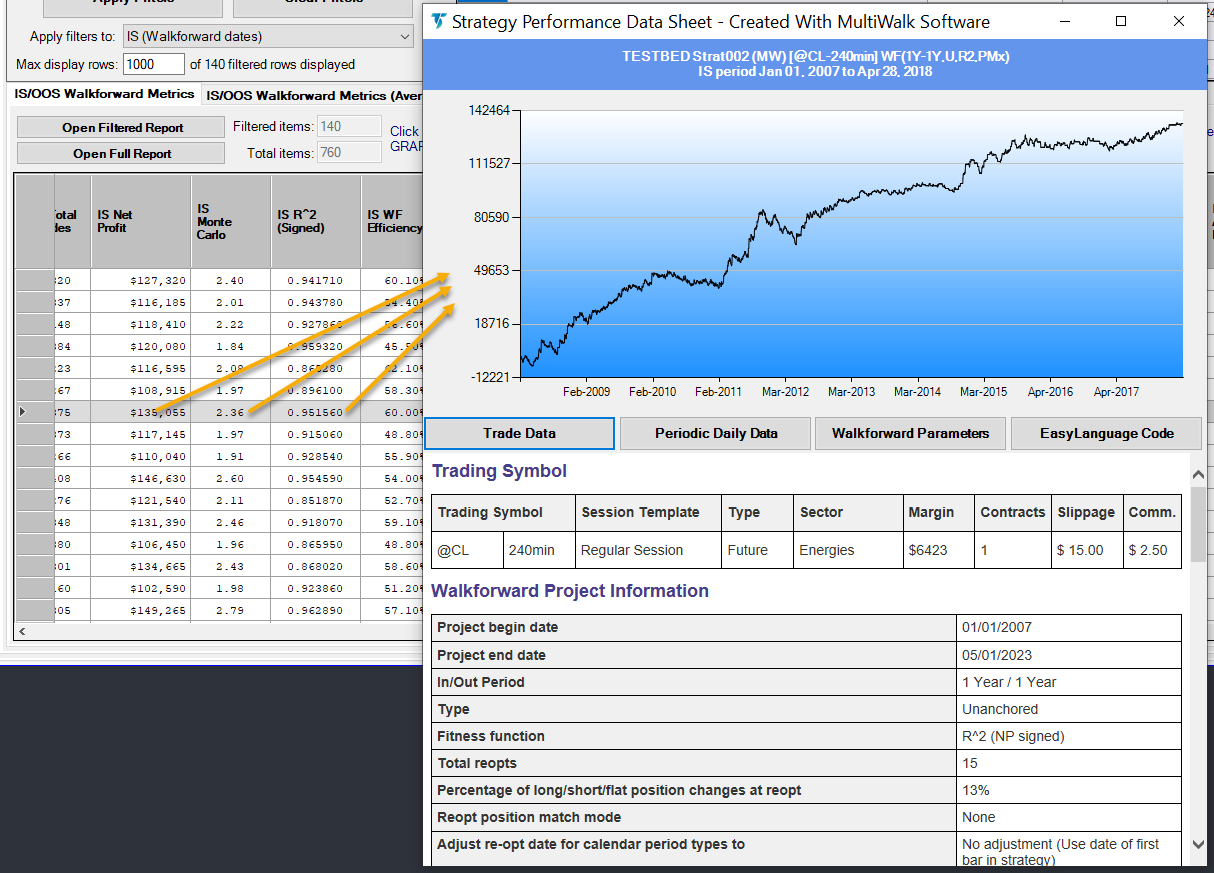
If you click on ANY IS specific report cell (IS dates or any IS performance metric), then a performance report will be display only for IS results.
If you click on ANY OOS specific report cell (OOS dates or any OOS performance metric), then a performance report will be displayed for both IS+OOS results.
The following example shows the report display when clicking on an IS column cell. ONLY in-sample results are displayed in the graph and performance report:


