Monte Carlo
Kevin Davey provides a spreadsheet for Monte Carlo analysis as part of his Strategy Factory workshop. MultiWalk is based on the algorithm that Kevin used in this spreadsheet. His spreadsheet computes Monte Carlo’s at various risk of ruin levels. The spreadsheet computes 2500 Monte Carlo trading simulations. Kevin’s Strategy Factory process indicates that we want Monte Carlo of 2.0 or greater Return/DD at 10% risk of ruin (meaning no more than 10% of the 2500 Monte Carlo iterations went bust/were ruined).
MultiWalk has three Monte Carlo options:
- 10% Risk of Ruin MC using Daily Mark-to-Market Equity PnL Data
- 10% Risk of Ruin MC using Closed Trades PnL Data
- Legacy Fixed Capital MC using Daily Mark-to-Market PnL Data
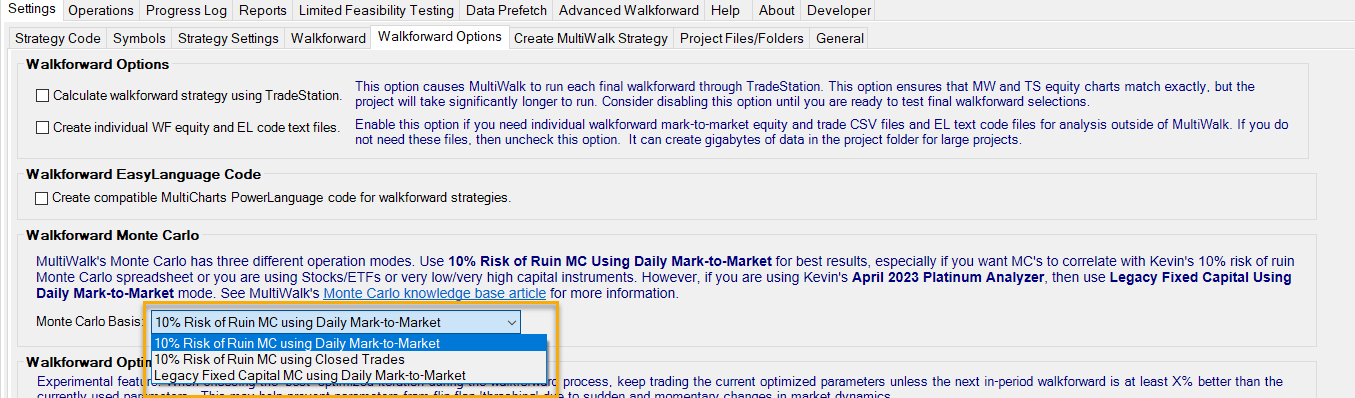
Note: new MultiWalk projects will default to use the Legacy Fixed Capital MC to support Kevin’s April 2023 Platinum Analyzer Excel worksheet. If you are NOT using his Platinum Analyzer, be sure to change the Monte Carlo selection to use the 10% Risk Of Ruin MC option.
10% Risk of Ruin Monte Carlo
MultiWalk’s 10% Risk of Ruin Monte Carlo conforms and correlates to Kevin Davey’s Strategy Factory Monte Carlo Excel spreadsheet.
MultiWalk’s MC will automatically determine the start and minimum (bust) capital necessary for the Monte Carlo based on the underlying data. If you have MultiWalk Pro, then the minimum (bust) capital will be set to the current overnight margin requirement, otherwise it will be calculated using the underlying data to establish an appropriate minimum level.
The Monte Carlo can use either daily mark-to-market PnL or closed trades data. I have found that using mark-to-market data is more robust, especially when trade count is low. My preference is to always use mark-to-market values since this gives a better representation of daily equity fluctuations and feeds more input data into the Monte Carlo engine.
MultiWalk will attempt to provide a Monte Carlo Return/DD that is with 1-2% of 10%. It will not spend a lot of time attempting to iterate through different start/minimum capital levels to determine an exact 10%. The gain would not be worth the time investment when thousands of Monte Carlos need to be computed for other walkforwards. Therefore you may see risk of returns between 8-12% or even more or less depending on the available underlying data.
For example, there are times when a 10% risk of ruin cannot be determined. This is the same phenomenon found in Kevin’s Monte Carlo spreadsheet and normally occurs when there are too few trades per year. With very little trade data, all the random simulations are going to be very similar. Risk-of-ruin is based on the number of iterations that made the account go below the minimum equity level to support trading the account. If there are always the same number of iterations that went “bust”, then there will be no point at which only 10% of the iterations went “bust”.
In this situation MultiWalk will determine the the risk of ruin closest to 10%, although it should be noted that in these situations it would be better to create a strategy that generated more trades, or use daily mark-to-market values as the basis of the Monte Carlo simulations, not the trades themselves.
Legacy Fixed Capital Monte Carlo
The legacy fixed capital Monte Carlo is the original Monte Carlo that MultiWalk (and it’s previous incarnation as MultiOpt) used for years. Kevin suggested that we simplify the Monte Carlo logic by fixing the start capital to $25,000 and quit capital to $5,000. He found that these produced workable results for futures. However, as time went on it became apparent that this produced some difficulties:
- Extremely high valued non-futures instruments could not compute a Monte Carlo value when starting with $25,000 when the more appropriate level would be $500,000 or more.
- Very low valued non-futures instruments like stocks and ETFs could not compute a Monte Carlo for the reverse reason: the starting and minimum capital was far too great.
- Even with futures data, the risk of ruins were often over 10% when making the $25,000/$5,000 assumption, which made it very difficult to correlate MultiWalk’s MC with Kevin’s spreadsheet.
Therefore this Monte Carlo computation is obsolete except in one situation: when using Kevin’s April 2023 Platinum Analyzer Excel worksheet. The rules that were derived for the spreadsheet were based on this Legacy Fixed Capital Monte Carlo. Therefore, if you want to reproduce his results, then use this legacy Monte Carlo option. Otherwise use the true 10% risk of ruin Monte Carlo option.
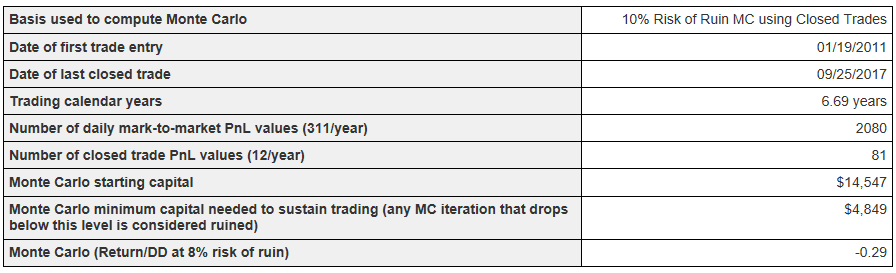
Monte Carlo Data Screen
The Monte Carlo data is consolidated on one screen. This screen is accessible from the Strategy Performance Data Sheet:
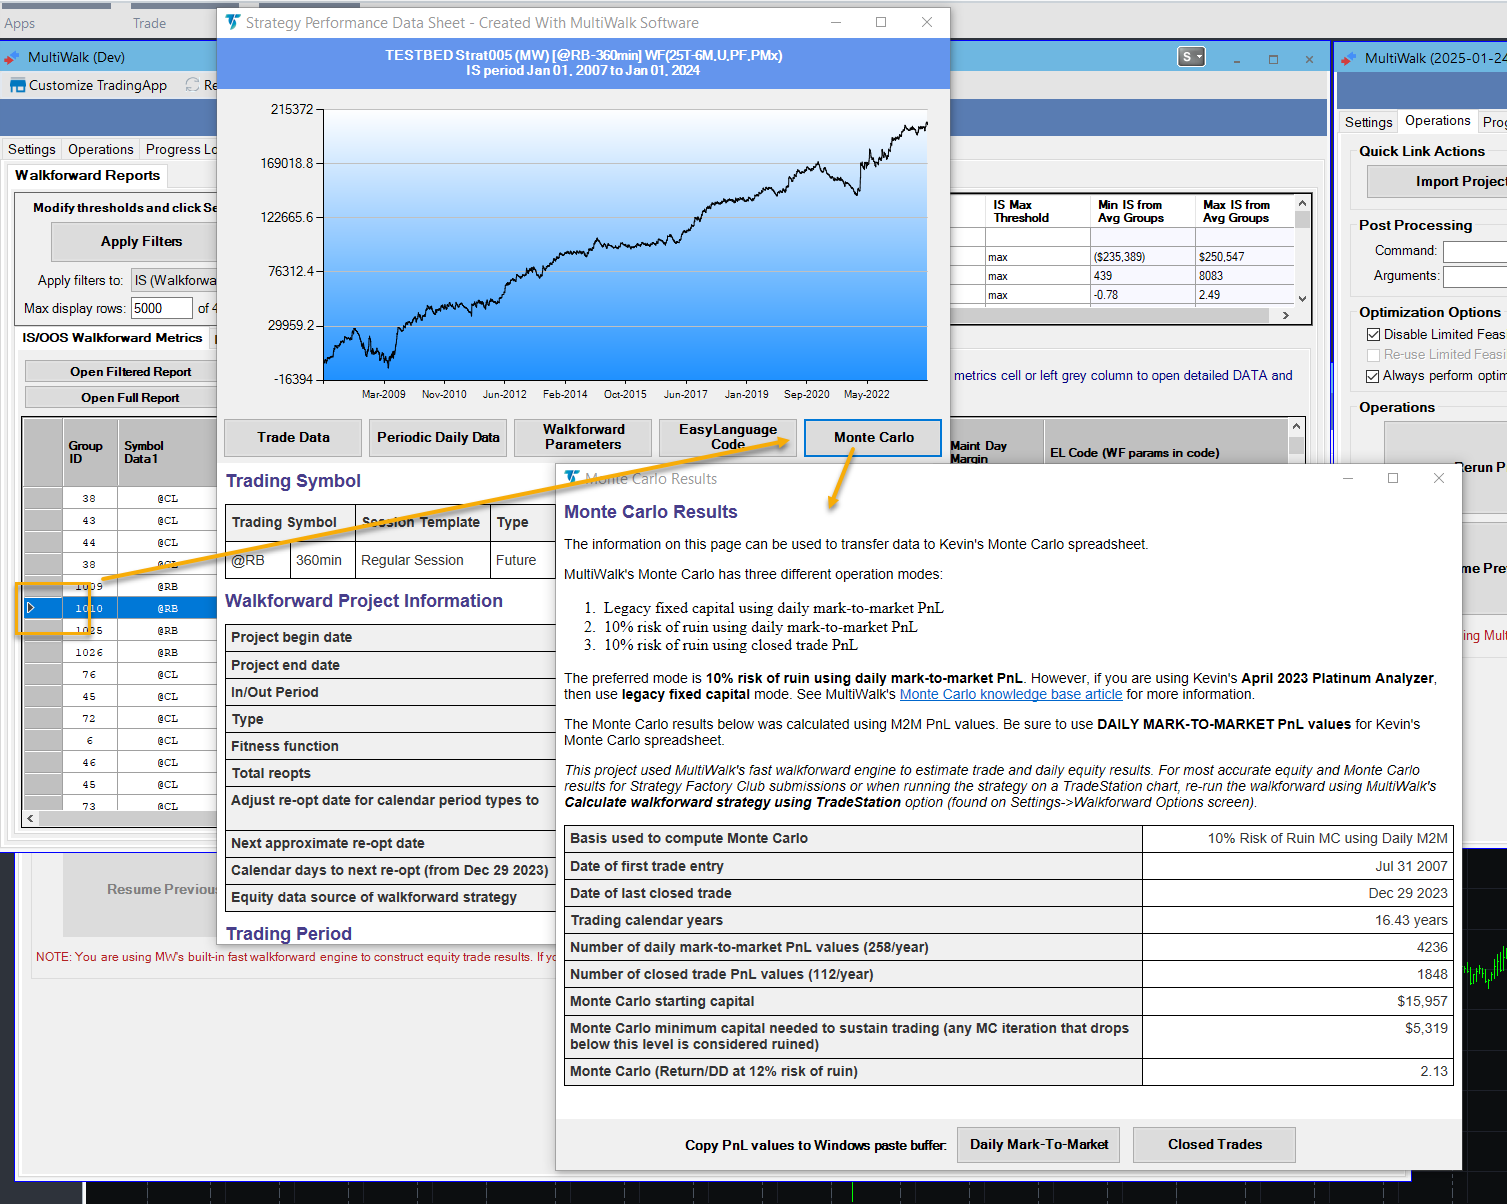
This information can be used to quickly and easily enter the data into Kevin’s spreadsheet to confirm and verify the results.
First, determine if you used daily mark-to-market data or trade data. This is indicated on the Monte Carlo screen. If your project used market-to-market data, then be sure to use mark-to-market data in Kevin’s spreadsheet. Conversely, if you used closed trade data, then use closed trade data in his spreadsheet.
There are six data values to copy to Kevin’s spreadsheet:
- Starting date of trading (first date of actual trade)
- Ending date of trading (last date of actual trade)
- Number of daily values or trade values
- Staring equity
- Minimum (stop trading) equity
- The actual mark-to-market or closed trade data
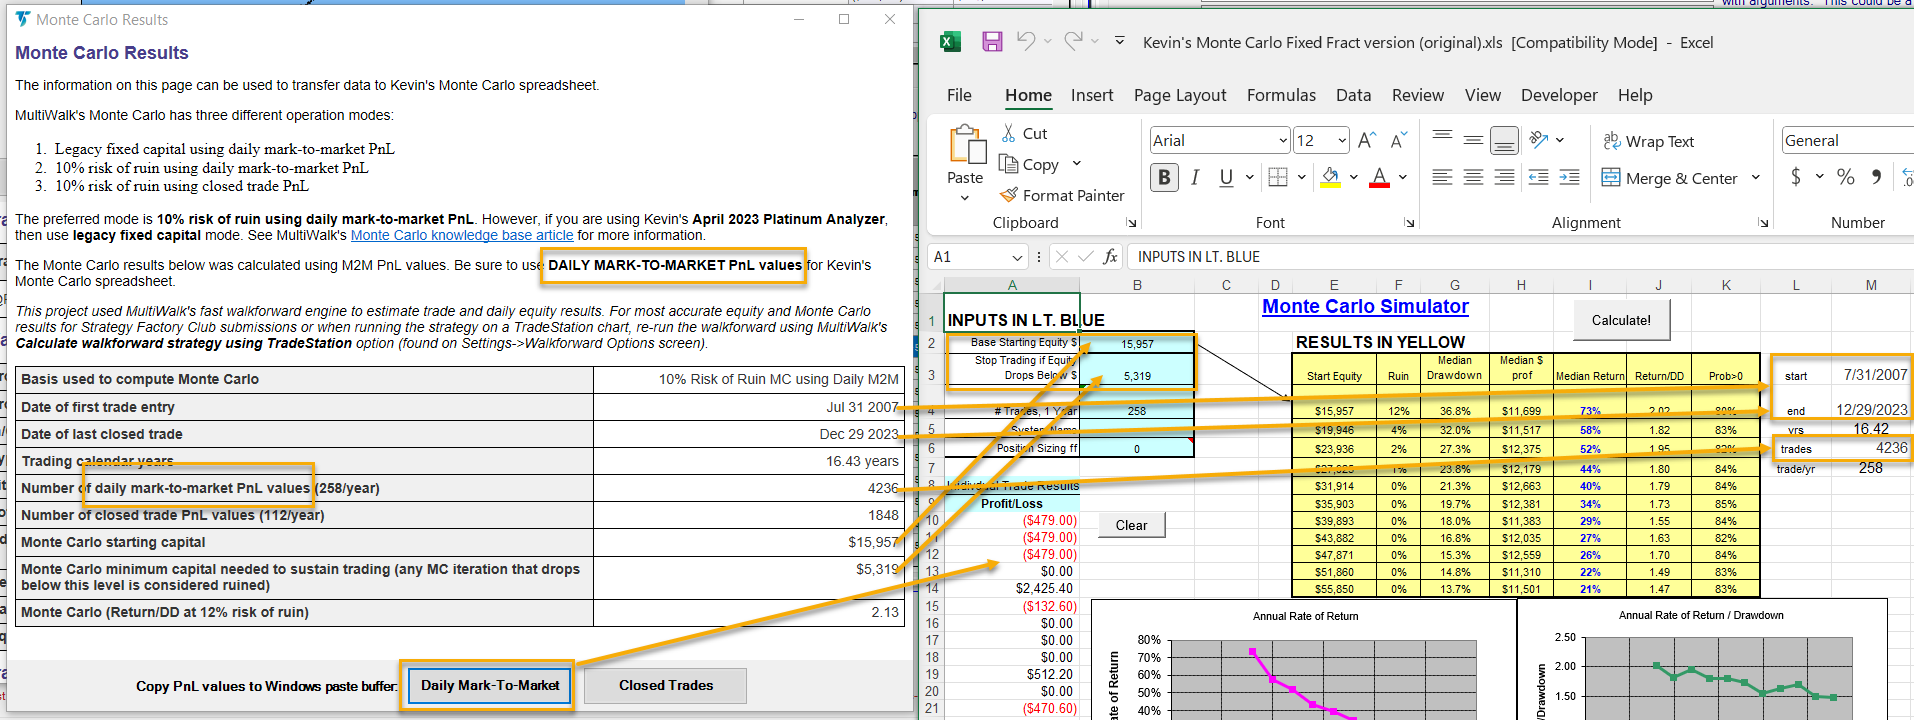
Notice that MultiWalk’s results are nearly identical to Kevin’s spreadsheet. MultiWalk calculated a Monte Carlo of 2.13 at 12% risk of ruin. Kevin’s spreadsheet calculated MC of 2.02 at 12% risk of ruin. There will always be some variation to Monte Carlos due to the randomized nature of the data.
But notice that the closest that MultiWalk was able to get to 10% was 12% risk of ruin. Looking at Kevin’s spreadsheet, the next percentage UNDER 10% was actually 4% with a 1.82 MC. This would not satisfy Kevin’s “MC 2.0 at 10% or less risk-of-ruin” requirement.
In situations like this you can try different values for the start capital (do not change the minimum/bust capital value). You may be able to get to a closer value under 10%.
I changed the starting capital to $17,000 and got these results:
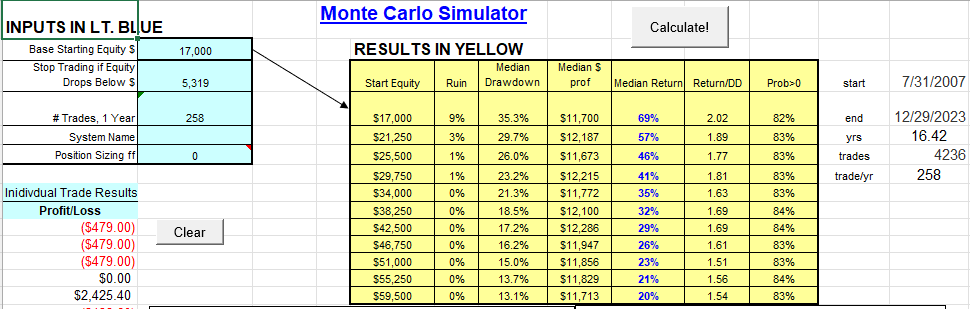
This gives us a MC of 2.02 at 9% risk of ruin which passes Kevin’s criteria. Remember that MultiWalk will stop trying to achieve 10% once it is within +/- 2% of the target. But with some manual trial-and-error with different starting capital values we can usually get a closer value using Kevin’s spreadsheet if we need that level of specificity (such as when submitting strategies to the club).
Monte Carlo Time Differences and Test Runs
A Strategy Factory member asked me “What are the time differences between the legacy fixed capital and the 10% risk of ruin calculations?” It’s a great question because determining the MC at 10% risk of ruin will necessitate multiple Monte Carlo calculations.
Spoiler alert: the difference in time cost between all Monte Carlo options was negligible. In other words, the time increase using the 10% risk of ruin MCs compared to the Legacy MC was insignificant. For this reason I suggest using the 10% risk-of-ruin MC using mark-to-market daily data as it simply uses more data points than closed trades and gives a better representation of daily trade fluctuations. The only time you would want to use the Legacy MC is if you are using Kevin’s 2023 Platinum Analyzer. His rules derived from his tests were using the Legacy MC.
So how can that be?
I did not want to approach this problem using a trail-and-error “brute force” method, but rather pre-loaded my 10% risk of ruin search by performing a low cost computation using the average of 100 Monte Carlo iterations to determine appropriate starting and minimum capital levels. I continued these low cost Monte Carlo calculations using a binary search pattern in order to “zero in” on a risk of ruin that got me close–often to within +/- 2% of the 10% target goal. Using the final capital levels as a seed to the 2500 Monte Carlo iteration computation often yielded results within +/- 4% of the 10% target goal. When it did not, I performed the costly 2500 iteration calculation again adjusting the start capital using the same binary search pattern as before to get closer in range to the 10% target goal. This was rarely needed, as can be seen in the following examples.
Here’s a time test for 5150 walkforwards. Each walkforward calculates results for 43 different different metrics (net profit, R^2, Monte Carlo, etc). So these times from the MultiWalk log file are for all 43. We can estimate the Monte Carlo calculation by dividing time per WF by 43. These tests were performed using MultiWalk’s optimized C++ code on Intel i9-13900K CPU.
From the MultiWalk log file:
Legacy fixed capital MC:
1st run: 2/26/2026 8:43:01 AM | All jobs complete for task TaskDoWalkforward | Total time: 0h 1m 55s
2nd run: 2/26/2026 9:03:37 AM | All jobs complete for task TaskDoWalkforward | Total time: 0h 1m 56s
10% risk-of-ruin MC using closed trades:
1st run: 2/26/2026 8:46:05 AM | All jobs complete for task TaskDoWalkforward | Total time: 0h 1m 55s
2nd run: 2/26/2026 8:57:06 AM | All jobs complete for task TaskDoWalkforward | Total time: 0h 1m 57s
10% risk-of-ruin MC using mark-to-market daily data:
1st run: 2/26/2026 8:49:31 AM | All jobs complete for task TaskDoWalkforward | Total time: 0h 1m 57s
2nd run: 2/26/2026 9:41:40 AM | All jobs complete for task TaskDoWalkforward | Total time: 0h 1m 57s
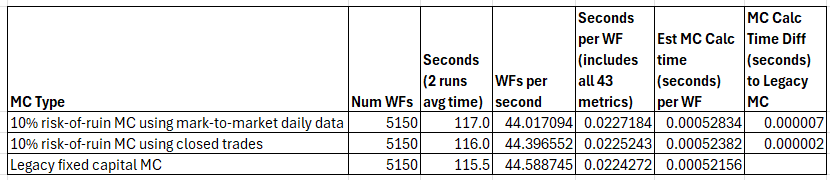
It took 0.02 seconds to calculate all 43 metrics per walkforward, whether using the Legacy MC or 10% risk of ruin MCs.
This is approximately 0.0005 seconds per MC.
There was a slight time increase of 0.000007 seconds for 10% risk-of-ruin MC using mark-to-market daily data and 0.000002 for 10% risk-of-ruin MC using closed trades.
This is absurdly negligible, but does now show a slight increase none-the-less.
Actual Comparison Examples of MC Options
To get a sense of the difference between the various MC options, I chose a few examples from the above 5150 walkforwards.
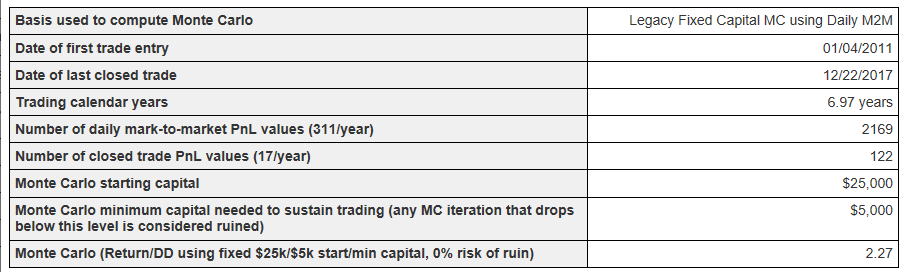
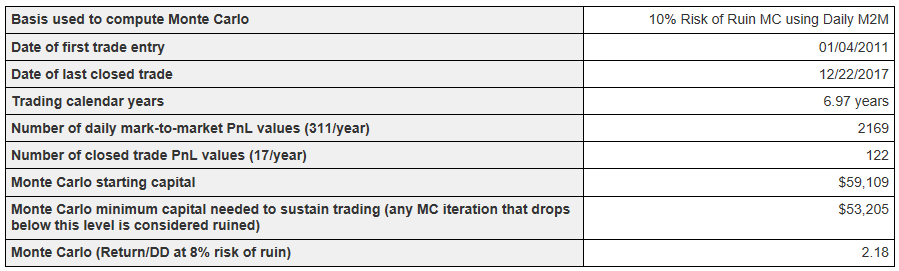
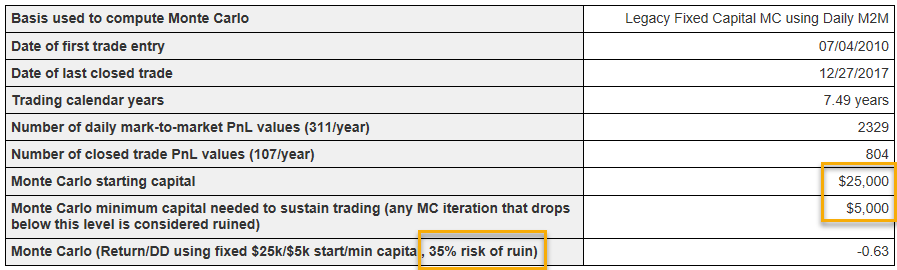
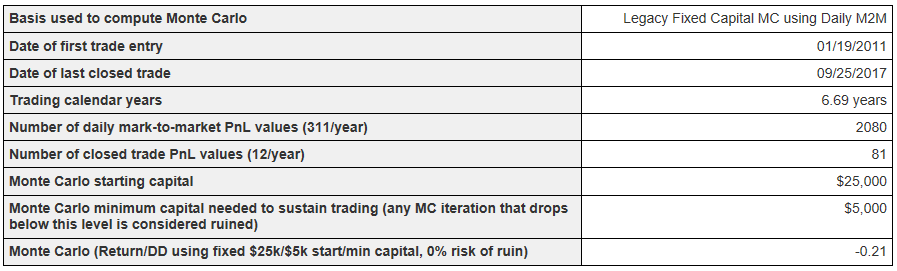
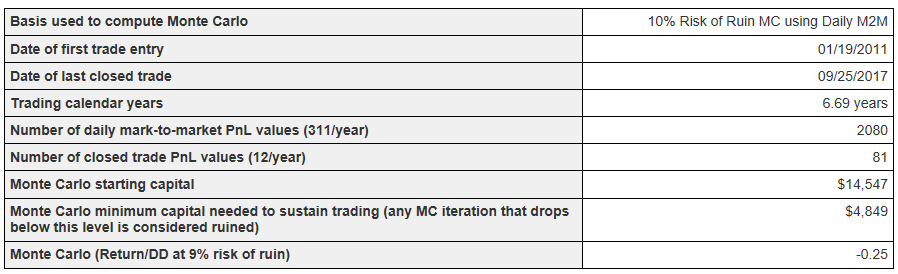
The following example demonstrates that the Legacy MC computed an MC at 35% risk of ruin, far from our 10% target goal. This is why MultiWalk’s MC did not always conform to Kevin’s 10% risk of ruin spreadsheet. Also notice that the starting/stopping capital levels are much more realistic using MultiWalk’s 10% risk of ruin MC option.
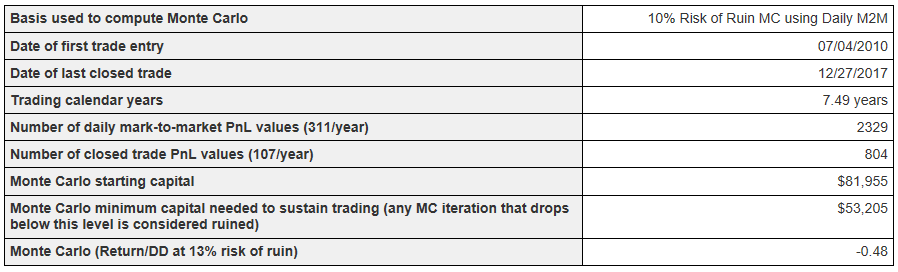
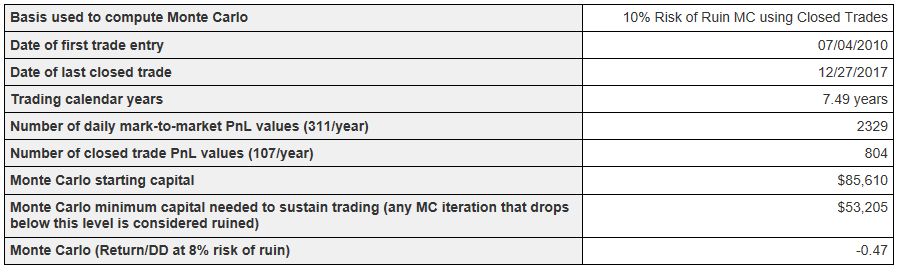
And sometimes, despite risk of ruin differences, the Legacy MC yielded similar results as the 10% risk of ruin MC option, even though the result, in the following two examples gave the MC at 0% risk of ruin. This is why the Legacy MCs sometimes matched MC results at 10% risk of ruin.
Example 1:
Example 2: